Moz Q&A is closed.
After more than 13 years, and tens of thousands of questions, Moz Q&A closed on 12th December 2024. Whilst we’re not completely removing the content - many posts will still be possible to view - we have locked both new posts and new replies. More details here.
Google Trends Data Weird Since 1/1/2022
-
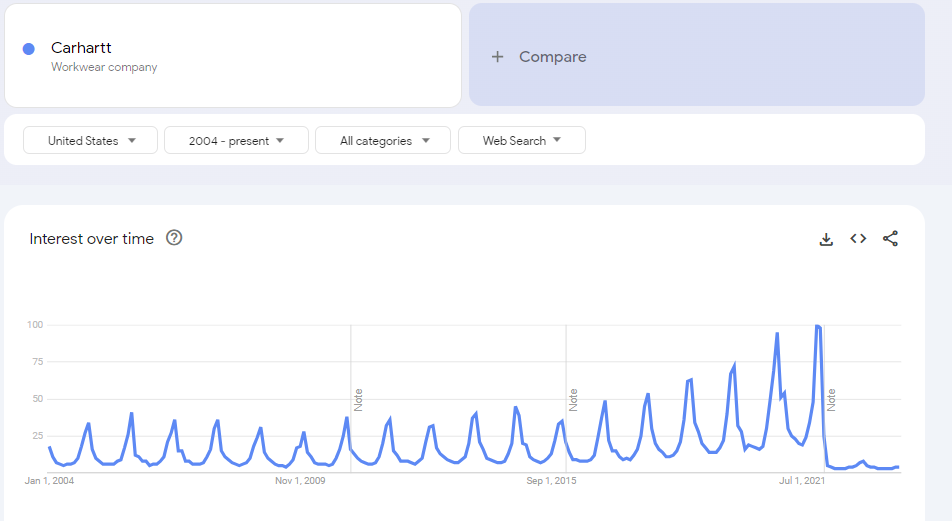
I am finding several instances of weird data drop offs on Google Trends at 1/1/2022. It seems like it's for data associated with a type/category as opposed to a search term. Here are some examples of "search interest" dropping suddenly off to next-to-nothing for prominent brands.
- Patagonia / clothing company
- Lands' End / clothing company
- Carhartt / workwear company
Example screenshot.
Does anyone know what the cause of this is? Has Google stated anything directly about why the data suddenly changed so significantly?
-
Google Trends data can appear strange due to seasonal patterns, news events, geographic variations, data sampling, facebook ads cloaking spelling differences, data lag, and other factors. Interpreting this data requires considering these aspects and analyzing it in the context of your research.
-
@LivDetrick Yes - you are pointing toward is important to notice - it can be a data glitch from google, but there is an event that is "Corona", that might make them to shift there strategy work around, like shifting the traffic from web to app or might be people preference of search have changed......
Until we do not study each business in detail its difficult to say.
Warm Regards
Rahul Gupta -
Google Trends data may appear unusual since January 1, 2022, due to various factors, including data anomalies, seasonal trends, algorithm updates, local influences, privacy measures, and changes in user behavior. To better understand these changes, check the date range, compare different search terms, and consider external events. If the issue persists, consult Google's official resources for updates and explanations.
-
@Suvidit-Academy thanks for the response, however, it seems terribly unlikely that these brands all had a legitimate massive fall off in search interest all on the exact same date...
-
Hello. Sometimes I get bored, but I know a game that will help me have fun. I visited the website https://linkaviator.com/lucky-jet/. This site offers a large list of casinos with the Aviator game. The biggest advantage of this site is that it contains information to help you get started playing the game, as well as casinos that have reviews and feedback from real users."
-
-
The drop-off in Google Trends data for prominent brands like Patagonia, Lands' End, and Carhartt on 1/1/2022 may be due to various factors, including potential changes in how Google collects and presents data, privacy policy updates, or fluctuations in search interest for those brands. It's essential to consider that Google Trends data can have occasional anomalies or inconsistencies, and it's advisable to cross-reference this data with other sources for a comprehensive analysis.
(PMP Exam Prep) (Project management courses) (Canada PR) (Study abroad)
-
The unusual data drop-offs on Google Trends around January 1, 2022, appear to affect not specific search terms but broader categories or types, as demonstrated by the sudden decline in "search interest" for prominent brands like Patagonia, Lands' End, and Carhartt. There may be various reasons for this phenomenon, such as changes in Google's algorithms or data collection methods. However, as of my last knowledge update in September 2021, Google had not publicly disclosed any specific reasons for such abrupt data changes. To get more accurate and up-to-date information, it would be advisable to check Google's official statements or contact their support.
(Canada PR) (Study abroad)(PMP Exam Prep)( list of documents required for Canada PR from India) -
Its a very nice observation, but to unearth the real reason need to understand that why people are searching for them like
- Carhartt is facing online boycott.
- Lands' End is struggling online, (https://www.digitalcommerce360.com/article/lands-end-ecommerce/), the article suggest that they are more focusing on Apps (might be connecting to the target audience directly on app).
- Patagonia - People are rating the company poorly (https://www.trustpilot.com/review/www.patagonia.com)
So here is a small input from the quick google search that there is something people are not comfortable with these companies.
Warm Regards
Rahul Gupta
Suvidit Academy -
The significant drop-offs in search interest for prominent brands like Patagonia, Lands' End, and Carhartt on Google Trends starting from 1/1/2022 could be attributed to various factors, such as changes in user behavior, adjustments in how Google collects and reports data, or even seasonal variations. Google may not have explicitly stated the cause for these changes. It's possible that these shifts in data could be due to fluctuations in public interest or how Google processes and presents trend data. To get a clearer understanding of these changes, it would be advisable to reach out to Google's support or explore their documentation for any relevant updates.
.
.
(Study abroad) (Canada PR) (PMP Exam Prep) (Colleges In Brampton Canada For International Students)
Got a burning SEO question?
Subscribe to Moz Pro to gain full access to Q&A, answer questions, and ask your own.
Browse Questions
Explore more categories
-
Moz Tools
Chat with the community about the Moz tools.
-
SEO Tactics
Discuss the SEO process with fellow marketers
-
Community
Discuss industry events, jobs, and news!
-
Digital Marketing
Chat about tactics outside of SEO
-
Research & Trends
Dive into research and trends in the search industry.
-
Support
Connect on product support and feature requests.
Related Questions
-

Whatstuffwherebot user agent messing up Google Analytics
Starting yesterday, Aug 26, 2020, I noticed a new bot crawling our site with user agent whatstuffwherebot. Google Analytics is counting these hits as human traffic, completely throwing off my numbers - yesterday, Analytics reported nearly triple my typical number of visitors. As of now, Search Console only shows data through Aug 25 so I don't know if Search Console is also affected. Is anybody else seeing something similar? Does anybody know what the whatstuffwherebot bot is? I don't get any results when I search on Google or Bing. For what it's worth, the traffic is coming from Columbus, OH, running over Amazon AWS via 278 different IP addresses so far. Also, WordFence (my WordPress security plugin) correctly identifies these hits as bot traffic.
Reporting & Analytics | | ahirai0 -

Conflicting average position data from Google Search Console?
I'm looking at Google Search Console data in Google Analytics, specifically Average Position as given in the Landing Page report, and the same metric broken out by mobile and desktop in the Devices report. In the Landing Page report, I see an aggregated average position that's much higher/worse than an actual average of what is reported for mobile, desktop and tablet traffic under the Device reporting. For example: Mobile: 5 Desktop: 5 Tablet: 5 So the average still should be roughly 5, right? Why would the Landing Page then show an aggregate Average Position of 8? I wouldn't expect to see a precisely same average given that different device types have different proportions that could render differently when the buckets are combined, but this is a huge swing. In fact, the aggregate Average Position as given in the top level Devices report is closer to 5 than to the 8 shown in the Landing Pages report. (These aren't actual numbers, but are illustrative of what I'm seeing, by the way.) Unless I'm missing some vital difference in the way that Average Position is reporting for the Landing Page report versus the Device reports, it doesn't seem like this should be possible. What am I missing?
Reporting & Analytics | | BradsDeals0 -

Google Analytics - Average Position
Hi Just trying to get some clarity on Google Analytics Average Positions in "Aquistions/Search Engine Optimisation". For a very competitive keyword Google Analytics is saying i am on average position of 6. Is this Page 6? I am assuming position six would be 1.6?
Reporting & Analytics | | Cocoonfxmedia0 -

How does switching to HTTPS effect Google Analytics?
We are looking at making our site HTTPS. We have been using the same Google Analytics account for years and I like having the historical data. All of our pages will be the same, we are just going to redirect from the http to https. Does anything need to be done with Google Analytics? What about other addons such as Optimizely, Crazy Egg, or Share this?
Reporting & Analytics | | EcommerceSite0 -

Google Analytics and DNS change
Our new alumni application is going be tested at domain uva.imodules.com . We are going to collect traffic data with a Google analytics account number UA-884652-XX. So going to uva.imodules.com/myPage.html would send its data to Google Analytics with that account number. Then when it is ready for production we are going to just change the domain name of the application and switch the DNS over to dardencommunity.darden.virginia.edu . So going to dardencommunity.darden.virginia.edu /myPage.html would send its data to Google Analtics with that SAME account number. Aside from having the testing domain data in the same profile are there any other issues/problems we may run into?
Reporting & Analytics | | Darden0 -

No Social Sources in Google Analytics - what am I doing wrong?
Hello Everyone, I'm having a strange issue: I DO NOT have in my Google Analytics the "Social" tab under the Traffic Sources category. Look at the first image of this post: http://marketingland.com/google-analytics-social-reports-8138 How do you "get" that to show? Hope somebody has this issue and can help, Thanks a lot, Alex
Reporting & Analytics | | pwpaneuro0 -

Has Anyone Else Noticed A Jump In Google Analytics Traffic Since Session Parameters Were Changed?
Ever since Google Analytics changed their session parameters August 12th I have seen a 20% jump in organic traffic & bounce rates along with a decline in pages/visit and conversion rate. To be clear, I don't put a whole heck of a lot of stock in these metrics as stand-alone indications of how my site is performing. I'm just trying to get to the bottom of this blip. I noticed some other people mentioned a similar phenomenon in other SEO forums and blog comments, but nobody seems to be talking about this here at SEOMoz (unless I just haven't looked in the right place). I'm not saying the change I noticed has anything to do with the session update, I'm just wondering if anyone else has experienced something similar so that I can either cross it off the list of possible causes or explore further.
Reporting & Analytics | | eTundra0 -

How do shortened links show up in Google Analytics?
Hey, How do shortened links show up in GA? So if I tweet about something and use bitly, does twitter get the referral? I am thinking not. I have never seen bitly show up as a referrer, but we gets lots of clicks from those links. Hmmmm. Anyone? E
Reporting & Analytics | | ErinTM0